
Performance Benchmarks
These benchmarks are published to provide transparent, reproducible performance data for the Nexphant runtime.
Benchmark Methodology
All tests were executed using Grafana k6 with:
- 1,000 concurrent Virtual Users (VUs)
- 30-second sustained load
- Local execution environment
- 0% request failures
- Comparison between:
- Default Runtime Configuration (Untuned)
- Runtime-Tuned Configuration (Optimized)
Hardware
- OS: CachyOS x86_64
- CPU: AMD Ryzen 5 5600H (6C/12T)
- Memory: 16 GB DDR4
- Storage: NVMe SSD
- Runtime: Nexphant
Static JSON Baseline
Measures pure HTTP/runtime overhead without database interaction.
Benchmark Screenshots
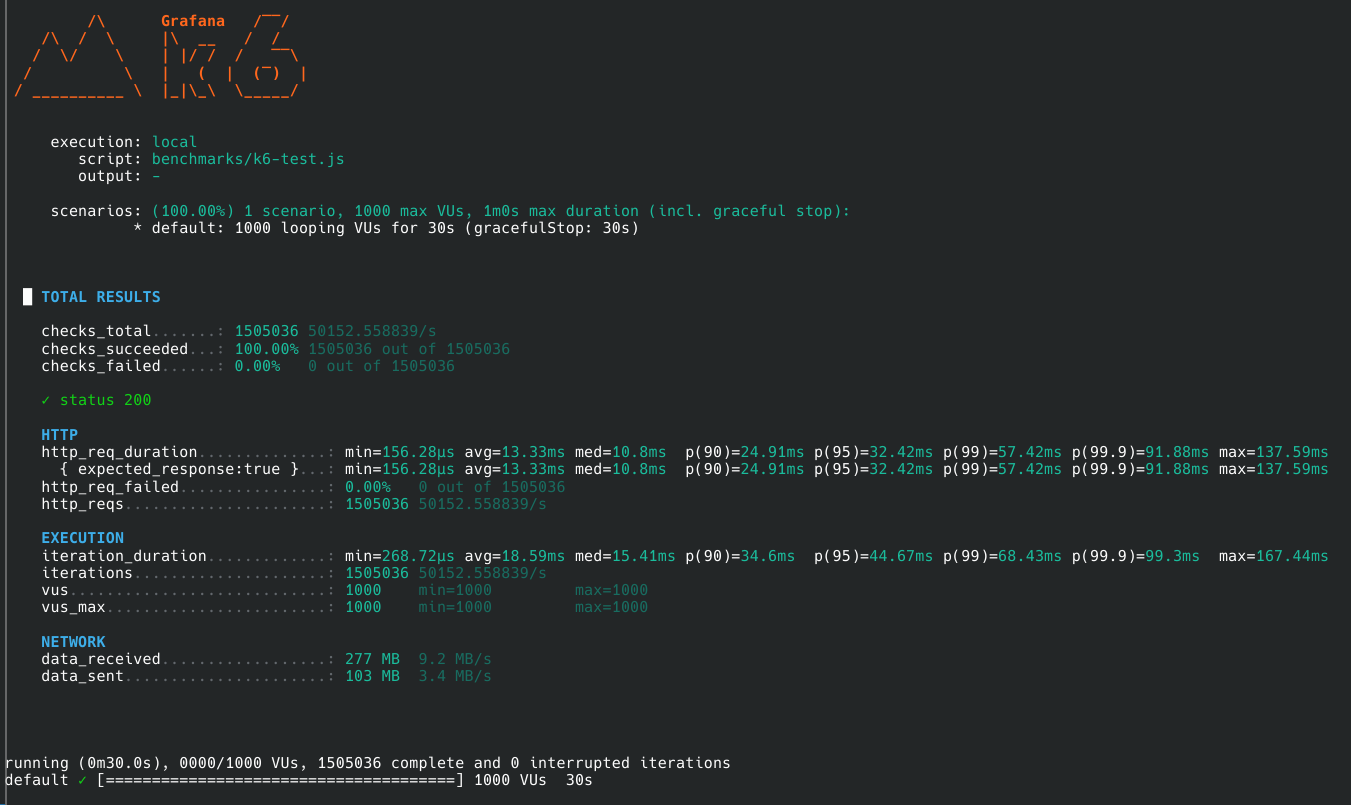
Untuned Runtime
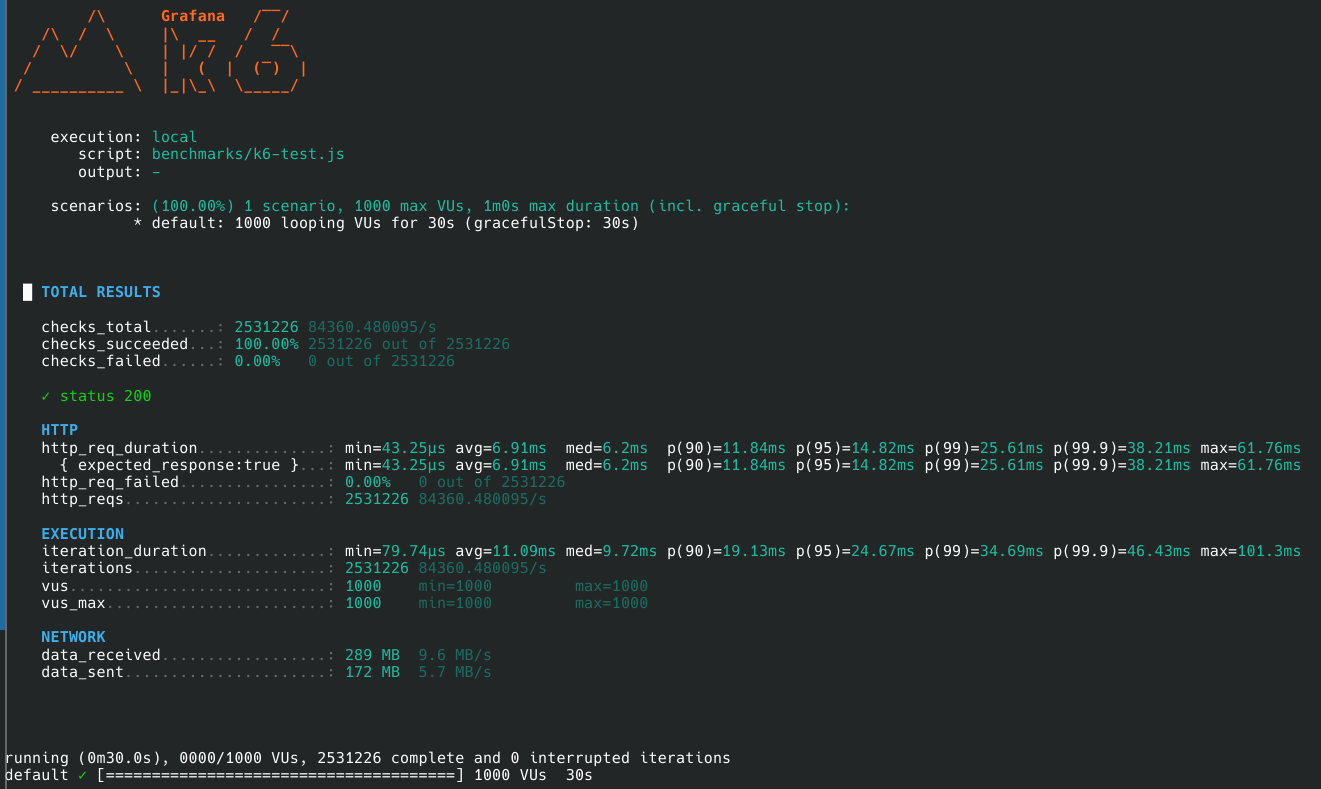
Tuned Runtime
Results
| Metric | Untuned | Tuned | Improvement |
|---|---|---|---|
| Throughput | 50,152 req/s | 84,360 req/s | +68.2% |
| Avg Latency | 13.33 ms | 6.91 ms | -48.2% |
| Median Latency | 10.80 ms | 6.20 ms | -42.6% |
| p95 | 32.42 ms | 14.82 ms | -54.3% |
| p99 | 57.42 ms | 25.61 ms | -55.4% |
| p99.9 | 91.88 ms | 38.21 ms | -58.4% |
| Failures | 0.00% | 0.00% | — |
Analysis
Runtime tuning increased throughput by nearly 70% while cutting tail latency by more than half. The p99.9 latency dropped from 91.88 ms to 38.21 ms, indicating significantly better behavior under peak concurrency.
SQLite WAL Workload
Measures a realistic application workload using SQLite in WAL mode with concurrent task retrieval.
Benchmark Screenshots
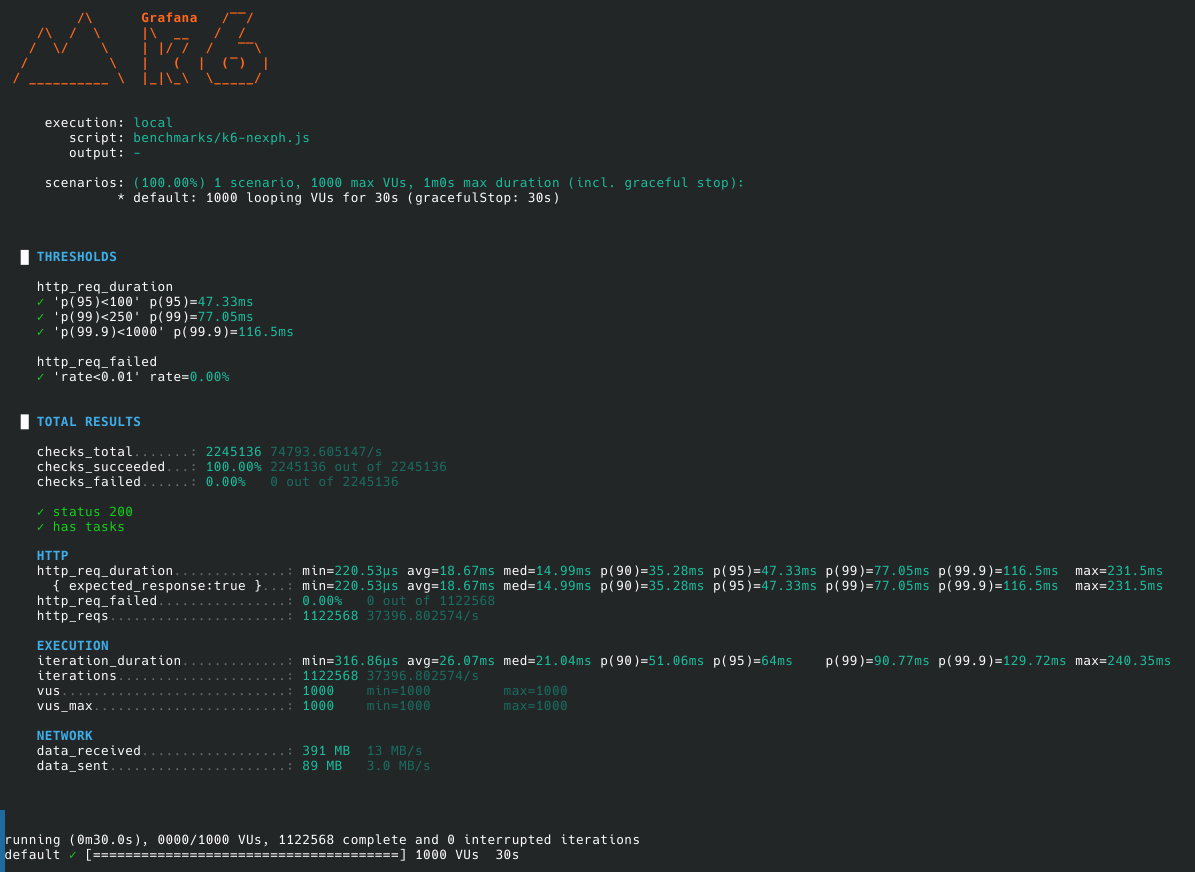
Untuned Runtime
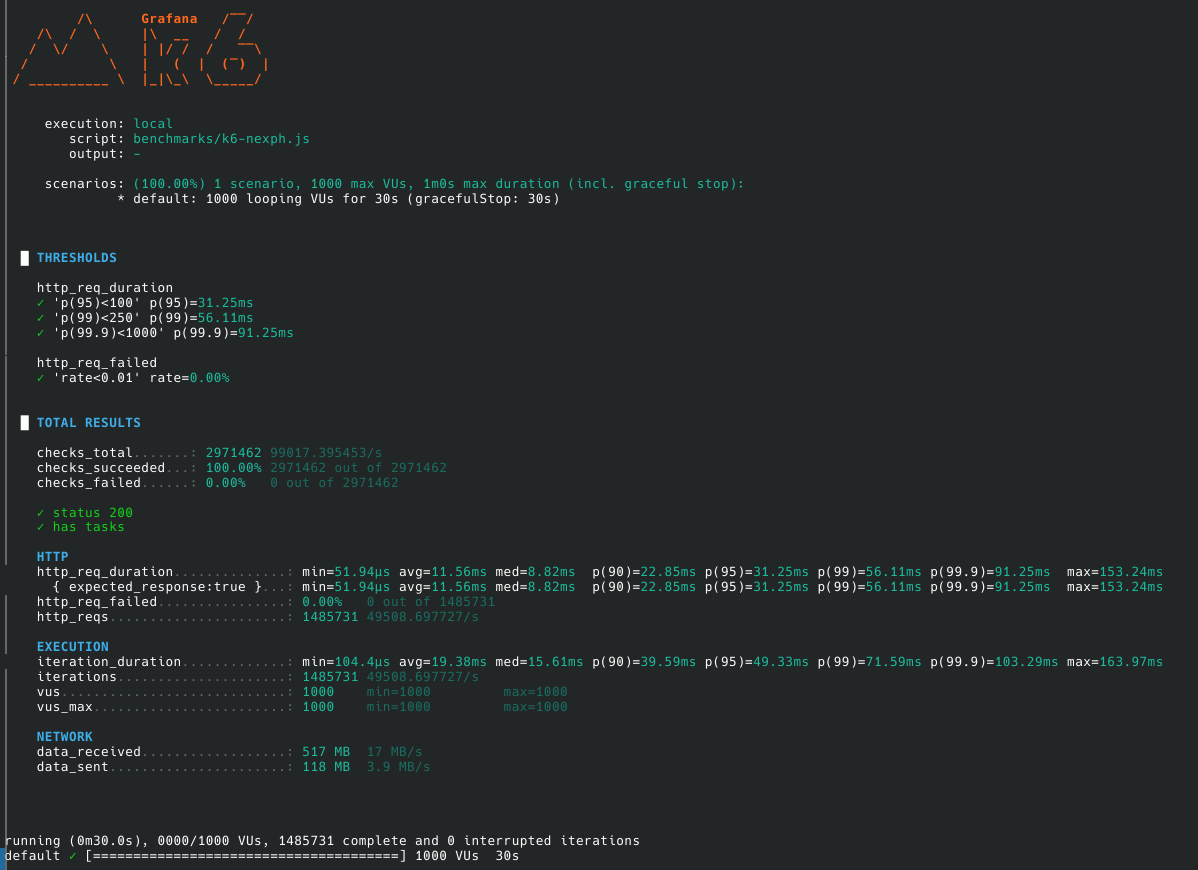
Tuned Runtime
Results
| Metric | Untuned | Tuned | Improvement |
|---|---|---|---|
| Throughput | 37,396 req/s | 49,509 req/s | +32.4% |
| Avg Latency | 18.67 ms | 11.56 ms | -38.1% |
| Median Latency | 14.99 ms | 8.82 ms | -41.2% |
| p95 | 47.33 ms | 31.25 ms | -34.0% |
| p99 | 77.05 ms | 56.11 ms | -27.2% |
| p99.9 | 116.50 ms | 91.25 ms | -21.7% |
| Failures | 0.00% | 0.00% | — |
Analysis
The SQLite workload demonstrates that runtime optimizations continue to provide meaningful gains even when database access becomes part of the request path. Throughput increased by over 12,000 requests per second while latency improved across all percentiles.
Credibility Notes
To avoid misleading benchmark claims:
- All benchmark logs are published.
- Both untuned and tuned results are shown.
- Failure rate is reported.
- Tail latency (p95/p99/p99.9) is included, not only average latency.
- Hardware specifications are disclosed.
- Workloads include both synthetic and database-backed scenarios.
These numbers represent local benchmark results on the hardware listed above and should not be interpreted as universal performance guarantees for all deployments.
Executive Summary
| Scenario | Req/s | Avg | p95 | p99 |
|---|---|---|---|---|
| Static JSON (Untuned) | 50k | 13.33 ms | 32.42 ms | 57.42 ms |
| Static JSON (Tuned) | 84k | 6.91 ms | 14.82 ms | 25.61 ms |
| SQLite WAL (Untuned) | 37k | 18.67 ms | 47.33 ms | 77.05 ms |
| SQLite WAL (Tuned) | 49k | 11.56 ms | 31.25 ms | 56.11 ms |